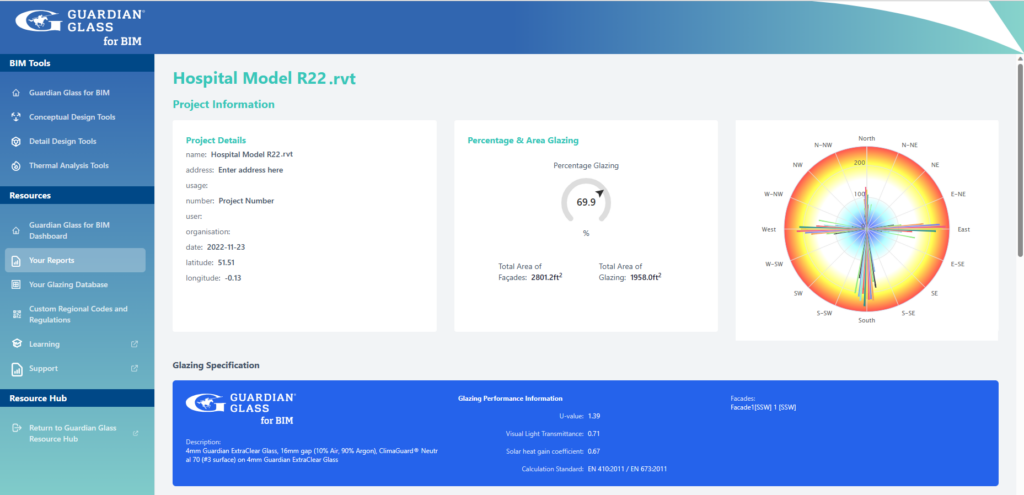
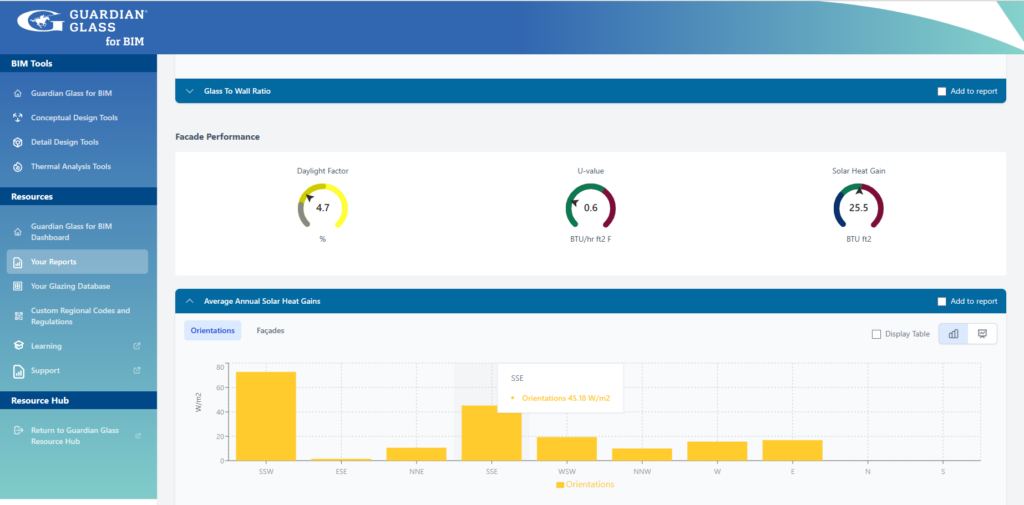
There is an option to create a HTML Report which will open in a browser window and provide more flexibility for creating custom charts. Check the HTML radio button to choose this option. An online report will open in the browser of your choice.
This will allow you to view the data and create custom chart data and styles which may be downloaded and saved as .pdf, .jpg files etc.
![]()
![]()